|
|
Bomberman Multiplayer
Authoritative multiplayer networking layer for Bomberman.
|
|
|
Bomberman Multiplayer
Authoritative multiplayer networking layer for Bomberman.
|
This page covers the observability layer built around the multiplayer system.
Diagnostics are part of the architecture rather than an afterthought. They exist to make packet flow, authority, prediction, and runtime anomalies visible during debugging and structured testing.
The diagnostics layer is built around these goals:
The project uses two different observability surfaces:
| Surface | Purpose | Output |
|---|---|---|
| Logs | readable live tracing during runtime | console and optional log file |
| Diagnostics | structured retained session data for review and comparison | JSON report files |
Logs are human-readable runtime traces built around spdlog, and have been very valuable for early development and debugging.
They are used for things like:
The main logging channels include:
clientservergamenet.connnet.packetnet.protonet.inputnet.snapshotnet.diagLog behaviour is configured through a combination of:
Configs/DefaultLogging.ini--log-level--log-fileDiagnostics are structured JSON session reports.
They are used to retain metrics, compare runs, and review behaviour after a session has ended.
At a high level:
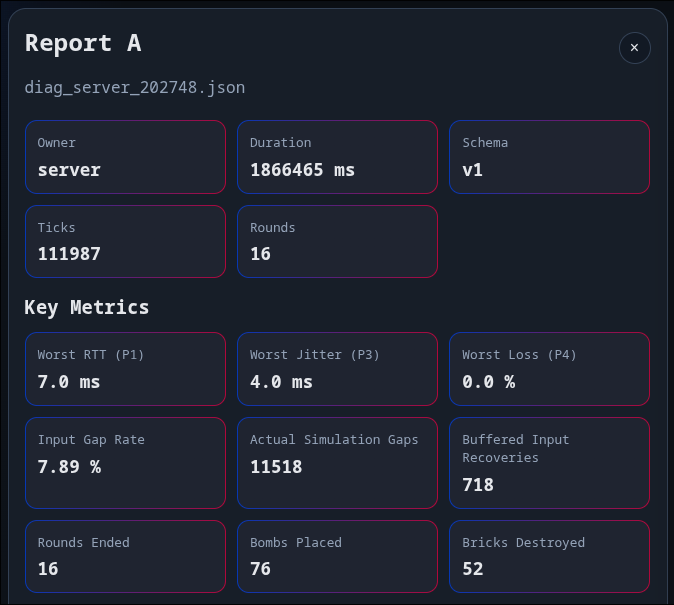
diag_server_<timestamp>.jsondiag_client_*.jsonServer-side diagnostics are built around NetDiagnostics.h.
They record the authoritative side of the session, including:
This makes the server side of the architecture measurable rather than opaque. Flow, continuity, and authoritative gameplay outcomes can all be inspected after a run.
Client-side diagnostics are built around ClientDiagnostics.h.
They record the player-facing side of the session, including:
This is where prediction and smoothing become measurable rather than purely subjective. The client-side experience can be compared against retained transport and correction data instead of being judged only by feel.
The observability layer is designed to stay useful without becoming spammy.
For that reason, diagnostics and logs include built-in noise control features such as:
Diagnostics are only useful if the important signals remain visible.
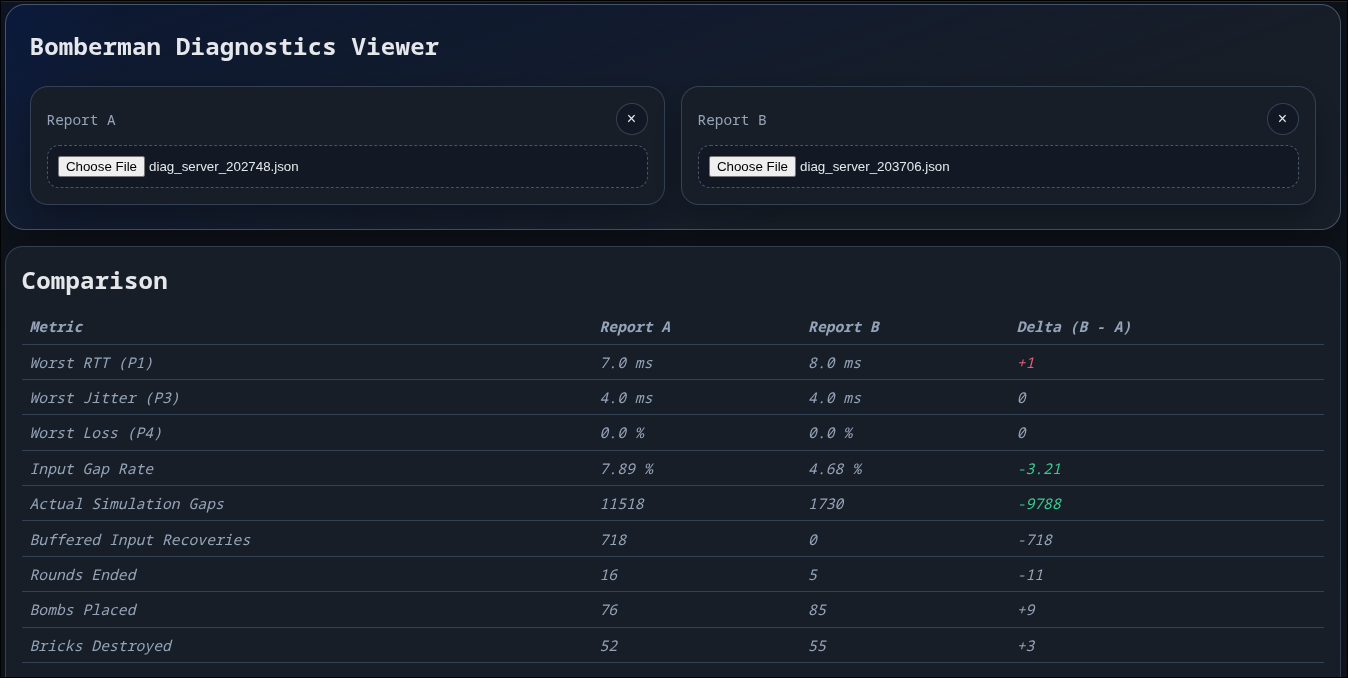
The repository includes a lightweight browser-based diagnostics viewer.
It is used to:
The repository also includes a helper around network impairment: netem_launcher.sh.
That tooling is used to:
On Linux, this is handled through a tc netem helper script in the repository. On Windows, impairment during testing was applied with external tools such as Clumsy.
Reports record the session configuration such as protocol version, tick rate, and prediction and smoothing state in order to allow for easier comparison and debugging.
The main observability-related runtime surface includes:
--net-diag--log-level--log-fileSome gameplay-facing toggles also affect how diagnostics should be interpreted:
--no-prediction--no-remote-smoothingThe full CLI surface is listed in Reference.
Net/NetDiagnostics.hNet/NetDiagnostics.cppNet/ClientDiagnostics.hNet/ClientDiagnostics.cppNet/NetDiagConfig.hNet/NetDiagShared.hUtil/Log.hUtil/Log.cppUtil/CliCommon.hConfigs/DefaultLogging.iniTools/diag_viewer.htmlTools/diag_viewer.jsTools/diag_viewer_launcher.shTools/NetworkTesting/netem_launcher.sh